
Describing Graphs and charts
7. The pie chart below shows the time allocation of students' daily activities. Summarize the information by selecting and reporting the main features and make comparisons where relevant. Write at least 150 words.
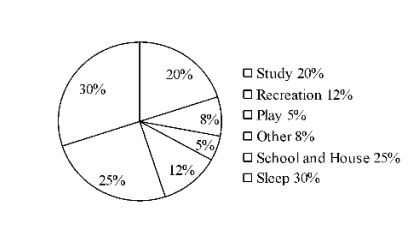
Answer: The pie chart shows the time allocation of students' daily activities which cover study 20%, recreation 12%, play 5%, other 8%, school and house 35% and sleep 30%. Every student has to perform his daily activities. From morning to evening, from day to night, he has to do his routine work. He has to follow a daily routine to perform his daily activities. A student is supposed to make the proper time allocation of his daily activities if he wants to succeed in life. In the graph the time covering for study is 20%. It shows the time frame of 4.8 hours. The time frame for recreation is 12% which is 2.88 hours of the day. It is not supposed to be usual for a student if he spends so much time in recreation. The time frame for play is 5% which is supposed to be ok on the part of a student. The time frame for other activities is 8%. It is also ok if the activities are relevant and necessary in the day to day life. The time frame for school and house is 25%. It is not supposed to be usual because the normal school hours are 6 hours i.e. 25% of 24 hours. The time frame for sleep is 30% which is more than 6 hours and it is not usual for a normal human being.
আরো পড়ুন : Describing Graph and charts-এর ৩টি প্রশ্নোত্তর, ২য় পর্ব
8. The graph below shows the result of the SSC exam of ABC secondary school from 2008 to 2012. Describe the chart in 150 words. You should highlight and summarise the information given in the chart.
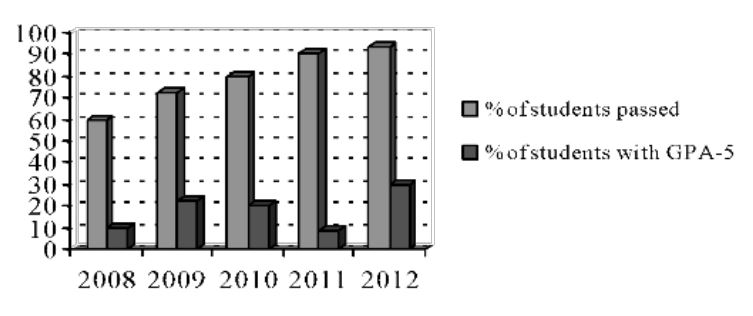
Answer: The graph shows the results of the SSC exam of ABC Secondary School from 2008 to 2012. According to the statistics of the graph, 60% students passed without GPA-5 and 10% students passed with GPA-5 in 2008. In 2009, 70% students passed without GPA-5 and 20% students passed with GPA-5 in 2009. 10% students without GPA-5 and 10% students with GPA-5 increased after one year. In 2010, 80% students passed without GPA-5 and 20% students passed with GPA-5 and 20% students passed with GPA-5. As a result, 10% students passed with GPA-5. As a result, 10% more students without GPA-5 increased and 10% students with GPA-5 decreased. In 2012, 90% students without GPA-5 passed and 30% students with GPA-5 passed. In this year too, 10% more students without GPA-5 passed but 20% students with GPA-5 increased. The statistics show that from 2008 to 2012, the number of the students passing without GPA-5 has increased at the rate of 10% and the number of the students passing with GPA-5 has increased, decreased and remained constant over the past few years.
লেখক : প্রভাষক
বীরশ্রেষ্ঠ মুন্সি আব্দুর রউফ পাবলিক কলেজ, ঢাকা
কবীর


